📡 Flow Friction Radar
The Flow Friction Radar is a visual tool that helps teams evaluate and prioritize Flow Friction Signals. It enables structured conversation around which signals to act on and when they should escalate into Flow Decision Triggers.
🧭 What is it?
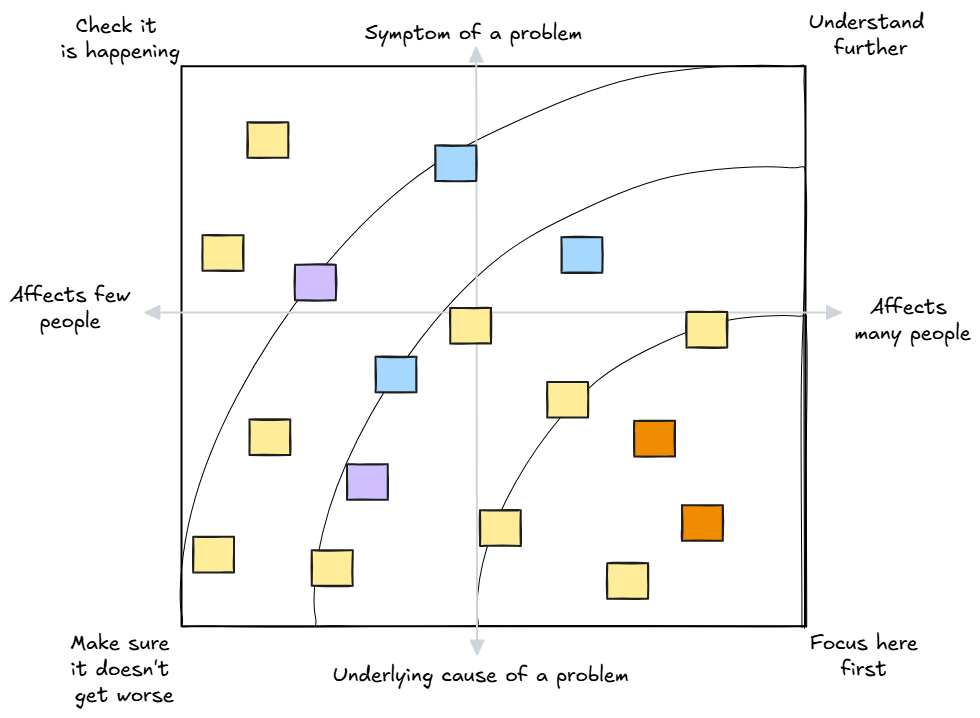
The radar plots Flow Friction Signals on two axes:
- X-Axis: Number of People Affected
- Left = Localized (1 team, 1 product area)
- Right = Widespread (multiple teams, critical path, broad user impact)
- Y-Axis: Symptom vs Root Cause
- Bottom = Root Cause (systemic issue driving other problems)
- Top = Symptom (surface-level effect, potentially caused by deeper issues)
🧩 What are we looking for?
The goal is to identify which signals should become Flow Decision Triggers, those that warrant a structured decision.
These appear in the bottom-right quadrant of the radar:
✅ High impact, root cause signals
These are:
- Affecting many people or teams
- Linked to recurring or critical flow issues
- Foundational to resolving other struggles
These should prompt further investigation or lead directly to a Flow Decision Record (FDR).
📉 How to use the radar
-
Gather signals
Collect blockers, tensions, or struggles during workshops, clinics, or interviews. - Plot the signals
For each signal, ask:- How many people or teams does this affect?
- Is this the root cause of other issues or just a symptom?
Place the signal accordingly on the radar.
-
Discuss & Cluster
Group similar signals. Look for patterns. Discuss dependencies between them. -
Identify Candidates for Action
Prioritize signals in the bottom-right quadrant for flow decisions. Signals in the top-right may also warrant decisions if feasible. Signals in the bottom-left are often worth watching,they may grow. - Document Triggers
When a signal becomes a trigger, document it as part of a Flow Decision Record.
📌 Radar quadrant summary
| Quadrant | Characteristics | What to do |
|---|---|---|
| 🔍 Top Left | Local, symptomatic | Monitor. Often team-level. Not urgent. |
| 📈 Top Right | Widespread, symptomatic | Investigate. Often highlight misaligned incentives or communication patterns. |
| 🧱 Bottom Left | Local, root cause | Track. Might become systemic over time. Useful for local experimentation. |
| 🚨 Bottom Right | Widespread, root cause | PRIORITIZE. Strong candidate for a Flow Decision Trigger. |
🛠️ Practical tips
- Use sticky notes or cards to place signals physically or digitally
- Encourage teams to move signals as their understanding evolves
- Run a Flow Friction Discovery every 2–4 weeks to assess movement
- Use color-coding to highlight categories (e.g., platform, ownership, feedback loops)
🎯 From signal to decision
The radar doesn’t just help visualize, it helps reason.
“This signal keeps showing up in different teams… and it’s connected to several delivery delays. Let’s elevate it to a trigger.”
When you’re ready:
- Draft a Flow Decision Record (FDR)
- Include the radar placement as part of its Context
- Track how the signal-to-trigger path supports prioritization